Claude Code Stats.
Token stats from JSONL.
A Python script reads Claude Code's local session logs and builds an interactive HTML dashboard: what your usage would have cost at API rates, where the tokens go, how a session actually unfolded. All local, no external dependencies.
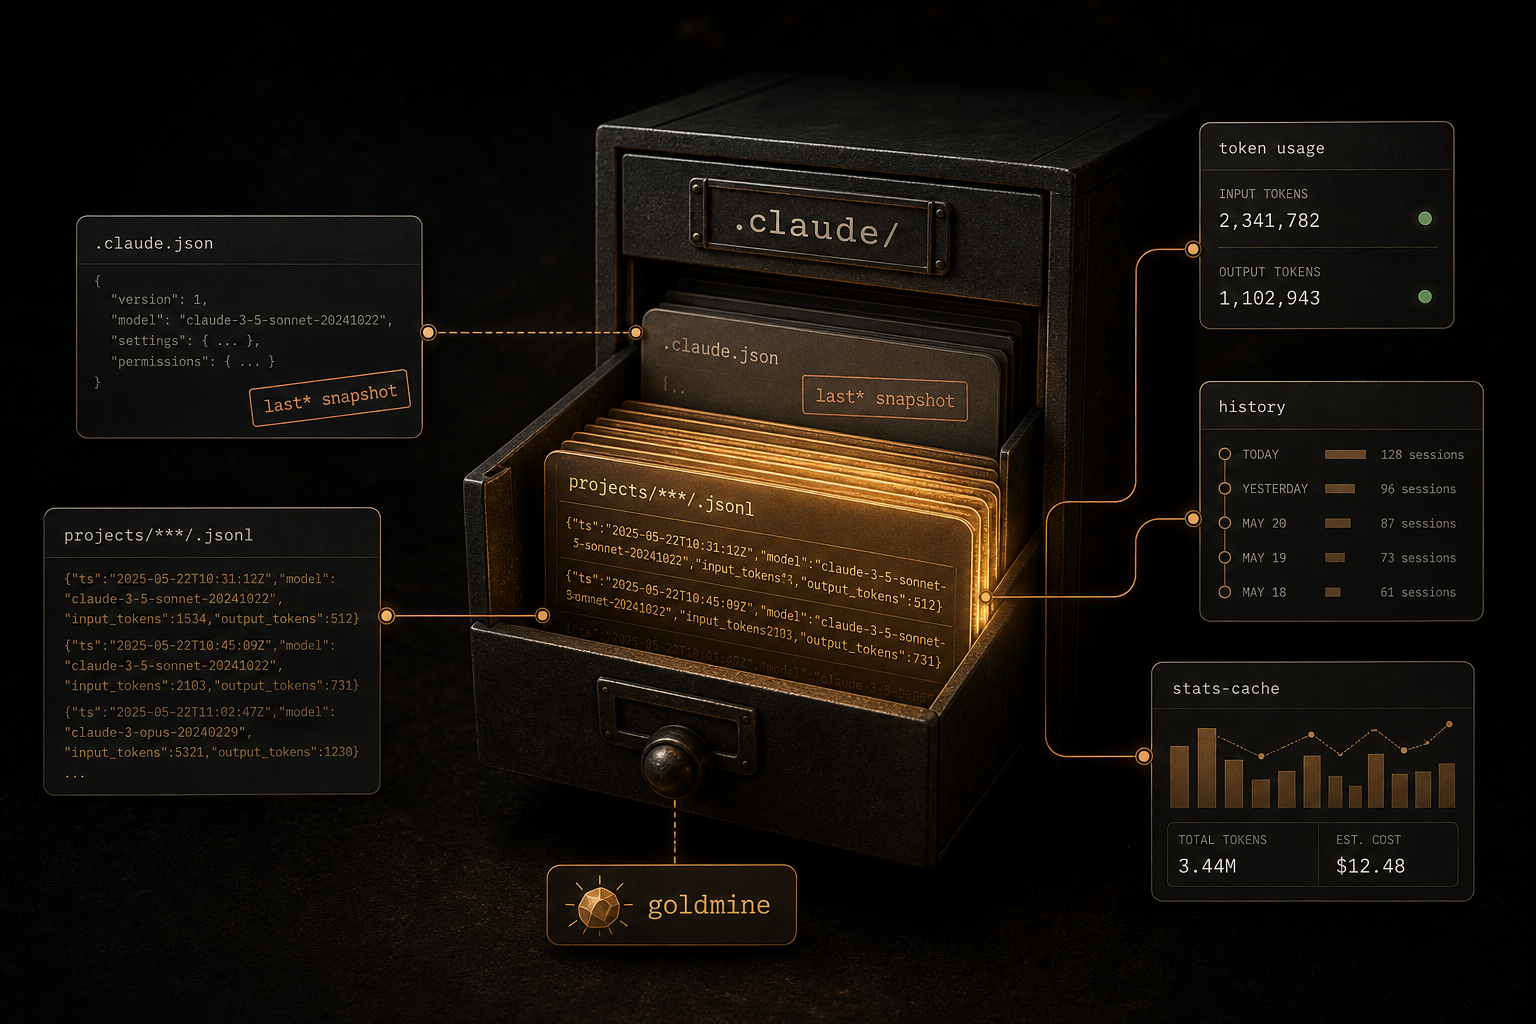
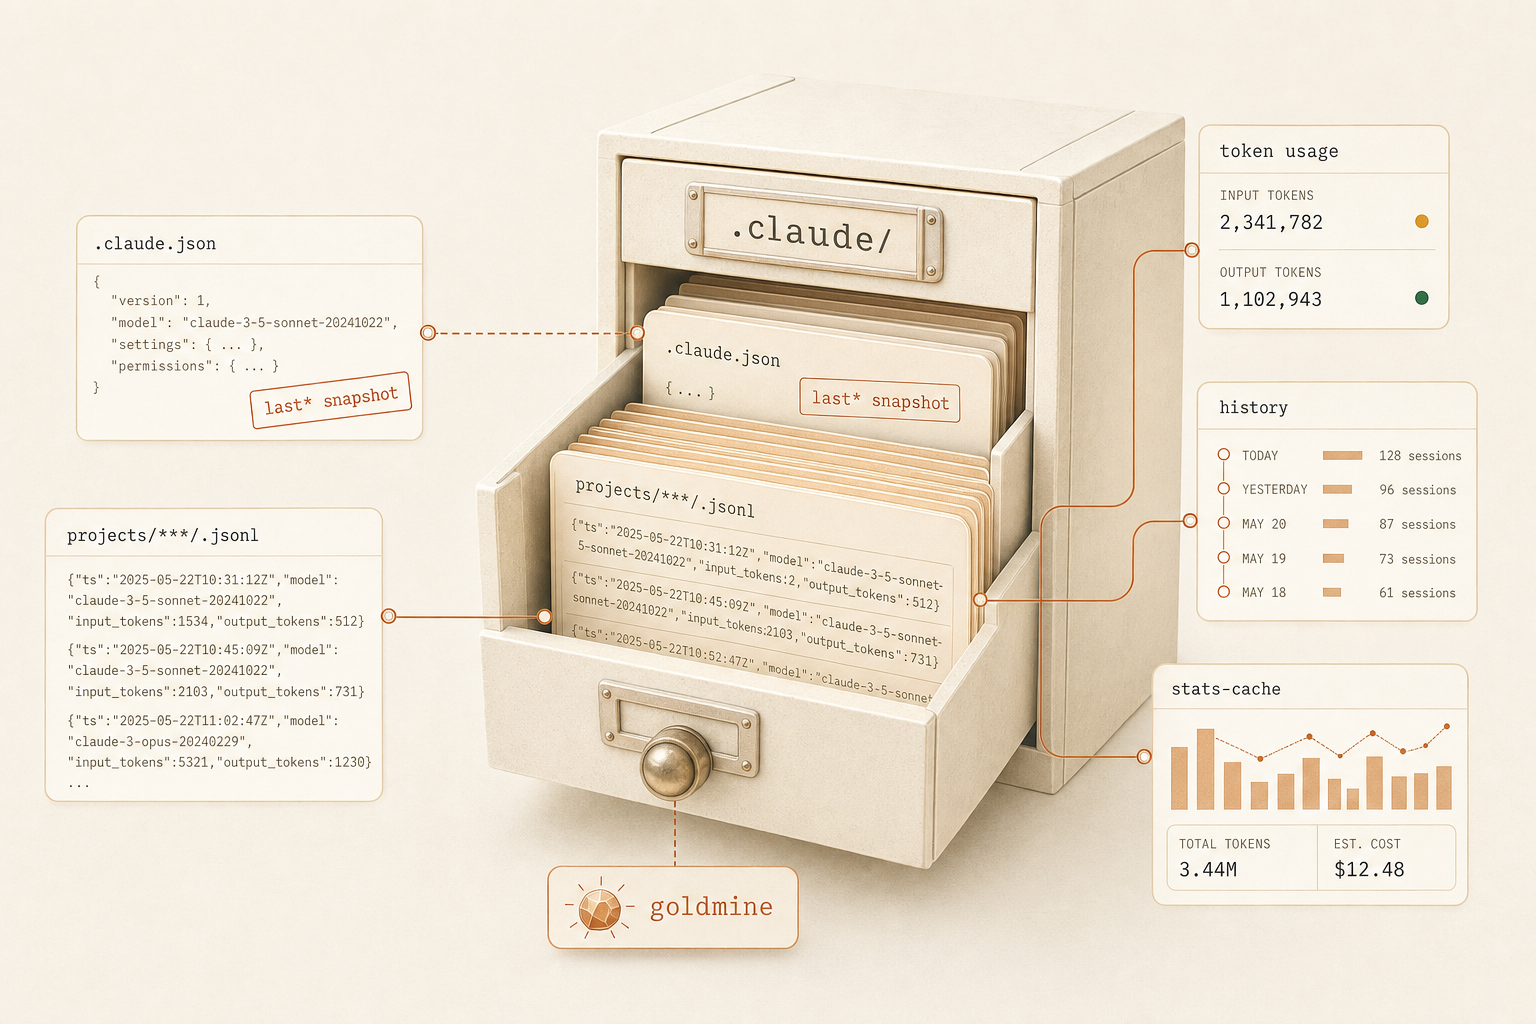
Every session leaves a log nobody reads
Claude Code stores every session as a JSONL file under ~/.claude/: every message, every tool call, every token. The data is complete, but raw. What a week of work actually consumed is only in there implicitly.
If you work on a subscription, you pay a flat price and never see what the same usage would have cost through the API. Whether Pro or Max pays off stays a gut feeling.
On top of that, Claude Code cleans up old session transcripts after 30 days by default. If you want to analyze your history, you first have to rescue it before it expires.
One script, one dashboard
Claude Code Stats is a single Python script with no external dependencies. It reads the JSONL logs, computes the statistics and writes one self-contained HTML dashboard. No server, no account, no cloud: the analysis stays on the machine it came from.


Installation
No package manager, no build step. Python 3.8+ is enough; the script uses only the standard library.
git clone https://github.com/AeternaLabsHQ/claude-code-stats.git
cd claude-code-stats
cp config.example.json config.json
python3 extract_stats.py
The result is a single HTML file (public/index.html) that opens straight in the browser, plus the raw data as JSON.
Rescuing your history
Claude Code deletes session transcripts after 30 days by default. To look back further, raise the limit in Claude Code’s settings.json:
{ "cleanupPeriodDays": 99999 }Without this setting, the dashboard window silently shrinks to the last 30 days.
Privacy
The dashboard shows what’s in the logs, and that’s a lot: code, paths, project names, memories. That’s why it stays a local file and doesn’t belong on a public server. For screenshots there’s a built-in anonymization mode (F2), and if you want to keep your project memories out of the analysis, run with --no-memories.
Status
v0.8.1 is the current version. The version number shown above is pulled live from the GitHub releases at build time.
Cost analysis
What your usage would have cost as pure API billing, broken down by model and day, and how much the subscription saves you.
Session flow
A canvas animation replays each session as a graph: user, Claude, tools, subagents, message by message.
Activity & errors
Heatmaps by hour and weekday, tool usage, error rates, git activity. All from the same logs.
How it came to be
The tool started with simple curiosity: what actually lives in the .claude directory Claude Code keeps locally? The first analysis became a dashboard, the dashboard became an open project.
The evolution came from the community: the session flow visualization goes back to a Reddit post that showed how beautiful it can be to watch Claude Code think. And missing model prices arrived as a community pull request.
Use it yourself?
Clone the repository and run one Python script, that's all it takes. Source and docs on GitHub.
View on GitHub ↗